
前言
課程 Operating System Implementation,Lab1 x86 Assembly and Bootloader 是個簡單的實作開場(Lab 源自於 MIT 課程),不過其中卻有蠻多學習的地方。這次來記錄一下 Lab 1 中的 The Stack 實作部分,實作過程中除了需要用 gdb 之外,也需要搭配 asm code。
實作內容
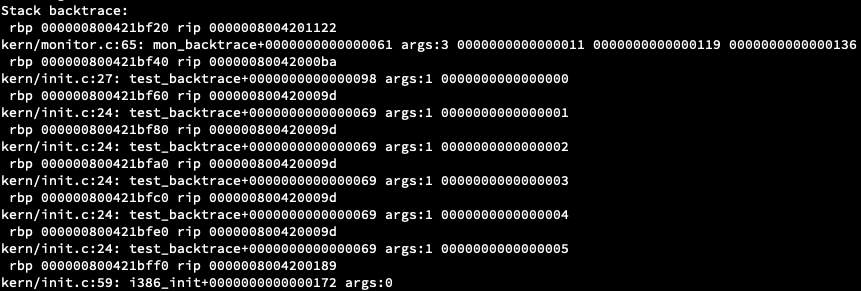
在教學程式中,會呼叫 test_backtrace(5),接著跑 recursion 直到碰到終止條件為止。
 1void i386_init(void)
 2{
 3    test_backtrace(5);
 4}
 5
 6void test_backtrace(int x)
 7{
 8    cprintf("entering test_backtrace %d\n", x);
 9    if (x > 0)
10        test_backtrace(x-1);
11    else
12        mon_backtrace(0, 0, 0);
13    cprintf("leaving test_backtrace %d\n", x);
14}
我們的目標,就是實作 mon_backtrace,追蹤進入 test_backtrace function 以及 recursion 的過程。
x86 Base Pointer & Stack Frame
而在這實作中,我們使用一個 register:
RBP(BP)
Stack Base Pointer register (BP). Used to point to the base of the stack.
來作為我們取得其他資訊的基點。
不過在實作之前,需要了解基本的 x86_64 stack frame 架構,參考 Stack frame layout on x86-64,可以有個基本概念:
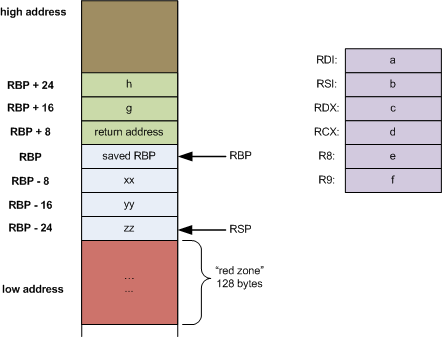
從圖中知道 function params、return address、local variables 在 stack 中的記憶體相對位置,所以透過位移,就可以得到對應數值。
接著我們透過 asm code 來了解 RBP 數值變化。
 18004200058:	55                   	push   %rbp
 28004200059:	48 89 e5             	mov    %rsp,%rbp
 3800420005c:	48 83 ec 10          	sub    $0x10,%rsp
 48004200060:	89 7d fc             	mov    %edi,-0x4(%rbp)
 5cprintf("entering test_backtrace %d\n", x);
 68004200063:	8b 45 fc             	mov    -0x4(%rbp),%eax
 78004200066:	89 c6                	mov    %eax,%esi
 88004200068:	48 bf c0 93 20 04 80 	movabs $0x80042093c0,%rdi
 9800420006f:	00 00 00
108004200072:	b8 00 00 00 00       	mov    $0x0,%eax
118004200077:	48 ba ad 15 20 04 80 	movabs $0x80042015ad,%rdx
12800420007e:	00 00 00
138004200081:	ff d2                	callq  *%rdx
14if (x > 0)
158004200083:	83 7d fc 00          	cmpl   $0x0,-0x4(%rbp)
168004200087:	7e 16                	jle    800420009f <test_backtrace+0x47>
17test_backtrace(x-1);
用圖示來表示:
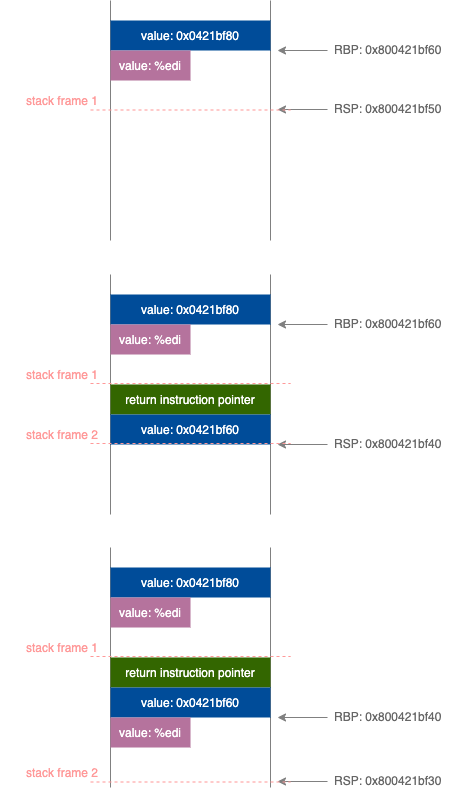
由於每次進入 test_backtrace 就會把前一個 RBP 地址 PUSH 到 stack 中,所以可以透過讀取 RBP 的值來移動到上一個 function 的 stack frame。藉由這樣的方式,就能持續地往前追朔 function。
那這向前追朔的過程要到什麼時候才要停止呢?
看 kern/entry.S:63 這段 source code,會發現:
1movq	$0x0,%rbp
2
3# Set the stack pointer
4movabs	$(bootstacktop),%rax
5movq  %rax,%rsp
6
7# now to C code
8movabs $i386_init, %rax
9call *%rax
%rbp 的值被設置為 0 後,才進入到 i386_init function 並執行 test_backtrace function,這意味著只要持續讀取 %rbp 的值,直到 %rbp 值為 0 即可停止。
有了這樣的概念後,就可以來實作一部分的 code:
1int mon_backtrace(int argc, char **argv, struct Trapframe *tf)
2{
3    uint64_t rbp = read_rbp();
4    while(rbp != 0)
5    {
6        rbp = *(uint64_t *)rbp;
7    }
8}
說明一下 read_rbp 這個 function,function 的 code 為:
1static __inline uint64_t read_rbp(void)
2{
3	uint64_t rbp;
4	__asm __volatile("movq %%rbp,%0" : "=r" (rbp)::"cc", "memory");
5	return rbp;
6}
值得注意的是 "cc", "memory" 這兩個 clobber arguments,根據 GNU 6.47.2 Extended Asm:
“cc” The “cc” clobber indicates that the assembler code modifies the flags register. On some machines, GCC represents the condition codes as a specific hardware register; “cc” serves to name this register. On other machines, condition code handling is different, and specifying “cc” has no effect. But it is valid no matter what the target.
如果 instruction 會修改 flag tegister ,那就要標記 “cc” (condition codes)。不過以 x86 的 MOV instruction 來說, MOV 並不會對 flag tegister 造成任何影響,因此即使沒有加註也不會發生錯誤。
“memory” The “memory” clobber tells the compiler that the assembly code performs memory reads or writes to items other than those listed in the input and output operands. Further, the compiler does not assume that any values read from memory before an asm remain unchanged after that asm; it reloads them as needed. Using the “memory” clobber effectively forms a read/write memory barrier for the compiler.
至於 “memory” 則是說明 asm code 有可能讀取非預期的記憶體位置,以及我認為比較重要的是有 read/write memory barrier 效果,由於 GNU gcc 編譯器在優化時,可能會改變記憶體讀取順序,透過 “memory” 在一些情況下能夠確保值是正確的。(其他範例與解釋可以參考Inline assembly)。
而對於 read_rbp 來說,“memory” 有沒有加都不會影響編譯後的結果。
RIP
x86_64 的 RIP 指的是 64-bit Instruction Pointer ,不過在實作題目的 RIP 意思有點不同,是指 “Return” Instruction Pointer,也就是上面在 stack frame layout 圖中標示的 return address。
The RIP value is the function’s return instruction pointer: the instruction address to which control will return when the function returns.
根據 stack frame layout, return address 是在 rbp 上方位置,也就是 %rip + 8,因此我們要做的就是把這個地址的值讀出來即可。
 1int mon_backtrace(int argc, char **argv, struct Trapframe *tf)
 2{
 3    uint64_t rip = 0;
 4    uint64_t rbp = read_rbp();
 5    while(rbp != 0)
 6    {
 7        rbp = *(uint64_t *)rbp;
 8        rip = *(uint64_t *)(rbp + 8);
 9    }
10}
DWARF
最後一個實作條件,就是要從 DWARF(Debugging With Attributed Record Formats) 中取得 function params 數量和值。
由於多數現代化的程式語言架構是由多個階層式 block 組成,DWARF 運用這特性將程式拆解成樹狀結構,並包含相關資訊(例如參數的大小、類型等),以利使用者查詢。近期 news 也有提到 GCC 11 Compiler Might Finally Enable DWARF 5 Debugging By Default,因此從此 Lab 實作中開始學習接觸 DWARF ,也是不錯的出發點。DWARF 介紹可參閱 Introduction to the DWARF Debugging Format。
Lab 1 的 source code 把讀取 DWARF 資訊過程包裝成較高階層的 function debuginfo_rip,以利課程使用,其 Ripdebuginfo struct 為:
 1struct Ripdebuginfo {
 2    const char *rip_file;		// Source code filename for RIP
 3    int rip_line;			// Source code linenumber for RIP
 4    const char *rip_fn_name;	// Name of function containing RIP
 5    int rip_fn_namelen;		// Length of function name
 6    uintptr_t rip_fn_addr;		// Address of start of function
 7    int rip_fn_narg;		// Number of function arguments
 8    int size_fn_arg[10];		// Sizes of each of function arguments
 9    uintptr_t offset_fn_arg[10];	// Offset of each of function arguments (from CFA)
10    Dwarf_Regtable reg_table;
11};
根據需求,實作中需要列印出 function params 的數量和值,因此我們將目光放在 rip_fn_narg、size_fn_arg、offset_fn_arg 這三個 member 上。
rip_fn_narg、size_fn_arg 這兩個非常好理解,但是 offset_fn_arg 這又該怎麼解釋,以及 offset 的基準點是什麼?
解析 offset_fn_arg
首先 offset_fn_arg 的註解是:
Offset of each of function arguments (from CFA)
先來查看 CFA 的意思,從 DWARF format DOC 可以看到解釋:
An area of memory that is allocated on a stack called a “call frame.” The call frame is identified by an address on the stack. We refer to this address as the Canonical Frame Address or CFA.
了解 CFA 的意思,接下來就來看一下 offset_fn_arg 這個值是從哪裡來的,追蹤一下 source code。 debuginfo_rip function 會呼叫 _dwarf_frame_params_init function:
1void _dwarf_frame_params_init(Dwarf_Debug dbg)
2{
3	/* Initialise call frame related parameters. */
4dbg->dbg_frame_rule_table_size = DW_FRAME_LAST_REG_NUM;
5dbg->dbg_frame_rule_initial_value = DW_FRAME_REG_INITIAL_VALUE;
6dbg->dbg_frame_cfa_value = DW_FRAME_CFA_COL3;
7dbg->dbg_frame_same_value = DW_FRAME_SAME_VAL;
8dbg->dbg_frame_undefined_value = DW_FRAME_UNDEFINED_VAL;
9}
從 _dwarf_frame_params_init 了解接下來的流程就是從 DWARF info 中讀取 function params 相關資訊。然後,我們快速地跳到 offset_fn_arg assign 過程:
1// list_func_die function
2if (atom == DW_OP_fbreg) {
3    uint8_t *p = loc_ptr;
4    ret_offset = _dwarf_decode_sleb128(&p);
5    offset += p - loc_ptr;
6    loc_ptr = p;
7}
8info->offset_fn_arg[info->rip_fn_narg]=ret_offset;
可以看到關建字 DW_OP_fbreg,搜尋 DWARF 手冊:
DW_OP_fbreg: The DW_OP_fbreg operation provides a signed LEB128 offset from the address specified by the location description in the DW_AT_frame_base attribute of the current function.
這樣就能知道,offset_fn_arg 就是以 DW_AT_frame_base 這個 attribute 為基準的 offset 值。
至於 DW_AT_frame_base attribute 就是指 base frame pointer,而根據 Stack Organization 可以知道, current stack frame layout 是從 return address 開始算起,因此我們在計算 base frame address,就要 +8 (old rbp value) +8 (return address value):
1// read DWARF info from RIP (return IP)
2struct Ripdebuginfo info;
3int ret = debuginfo_rip((uintptr_t)rip, &info);
4
5uint64_t rbp = read_rbp(); //current RBP
6uint64_t prev_rbp = *(uint64_t *)rbp; // back to the previous RBP
7uint64_t frame_base = prev_rbp + 8 + 8;
接著讀取 offset_fn_arg 的值,以 Lab 1 來說,第一個 params 的 offset 值是 -20,接著再把 base frame address + (-20),因為 x86 的 stack 是從 high address 往 low address 成長。
 1// read DWARF info from RIP (return IP)
 2struct Ripdebuginfo info;
 3int ret = debuginfo_rip((uintptr_t)rip, &info);
 4
 5uint64_t rbp = read_rbp(); //current RBP
 6uint64_t prev_rbp = *(uint64_t *)rbp; // back to the previous RBP
 7uint64_t frame_base = prev_rbp + 8 + 8;
 8
 9int argc = info.rip_fn_narg;
10for (int i = 0; i < argc; i++) {
11    int offset = info.offset_fn_arg[i];
12    uint64_t arg = frame_base + offset;
13    // TODO: we should check the size of args to the display correct value
14    cprintf("%016d ", *(uint32_t *)arg);
15}
最後再根據 params 的 size size_fn_arg 來顯示出正確的數值。(因為 test_backtrace 的 params size 是 4 byte,所以我就直接用 uint32_t 來顯示了)
完整 code
 1int mon_backtrace(int argc, char **argv, struct Trapframe *tf)
 2{
 3	uint64_t rip = 0, rbp = read_rbp();
 4	read_rip(rip);
 5	cprintf("Stack backtrace:\n");
 6	while(rbp != 0){
 7		cprintf(" rbp %016x rip %016x\n", rbp, rip);
 8		struct Ripdebuginfo info;
 9		int ret = debuginfo_rip((uintptr_t)rip, &info);
10		if (ret != -1) {
11			int narg = info.rip_fn_narg;
12			cprintf("%s:%d: %s+%016d args:%d ",
13				info.rip_file,
14				info.rip_line,info.rip_fn_name,
15				rip-info.rip_fn_addr,
16				narg);
17
18			// The frame base begins from return address
19			uint64_t frame_base = rbp + 8 + 8;
20			for (int i = 0; i < narg; i++) {
21				int offset = info.offset_fn_arg[i];
22				uint64_t arg = frame_base + offset;
23				// TODO: we should check the size of args to display correct value
24				cprintf("%016d ", *(uint32_t *)arg);
25			}
26		}
27		cprintf("\n");
28
29		rip = *(uint64_t *)(rbp + 8);
30		rbp = *(uint64_t *)rbp;
31	}
32
33	return 0;
34}
結論
透過這個作業可以確實地理解 stack frame ,並且對 DWARF 有初步了解,整體來說不難,但是還蠻有啟發性的。